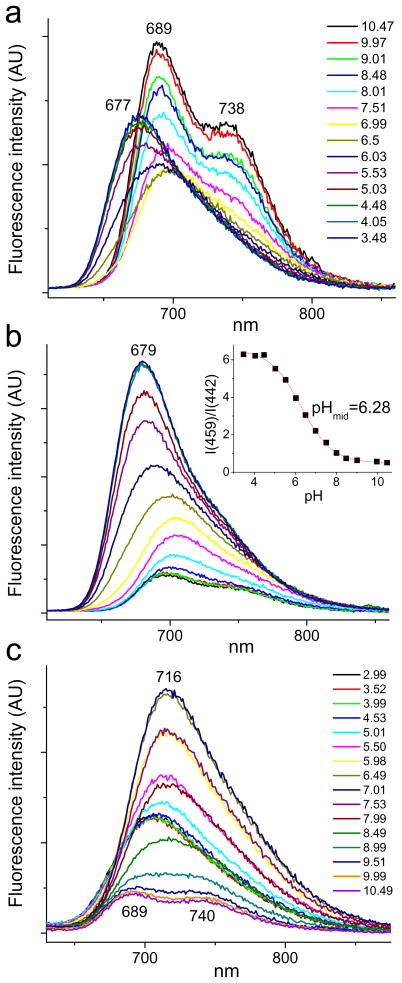
Figure 4.
Changes in fluorescence spectra of TCHpH upon changes in pH (pH is shown in the legend, upper graph). Buffer: phosphate, 50 mM. a - λex=442 nm; b - λex=459 nm; c - λex=490 nm. Inset: ratio of integrated fluorescence intensities vs pH: R=I(459)/I(442), where I(459) - fluorescence spectrum integrated from 600 to 860 nm, λex=459 nm; I(442) - fluorescence spectrum integrated from 700 to 860 nm, λex=442 nm.

