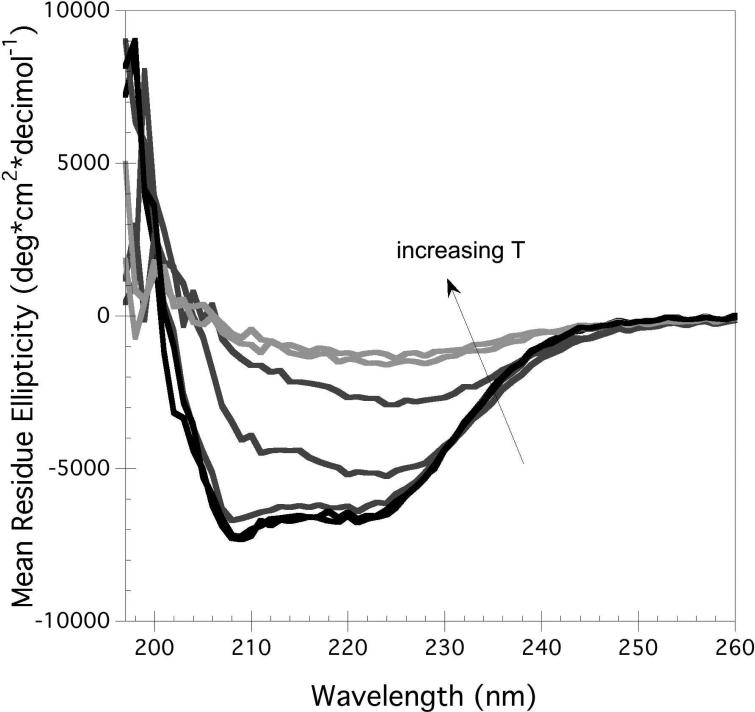
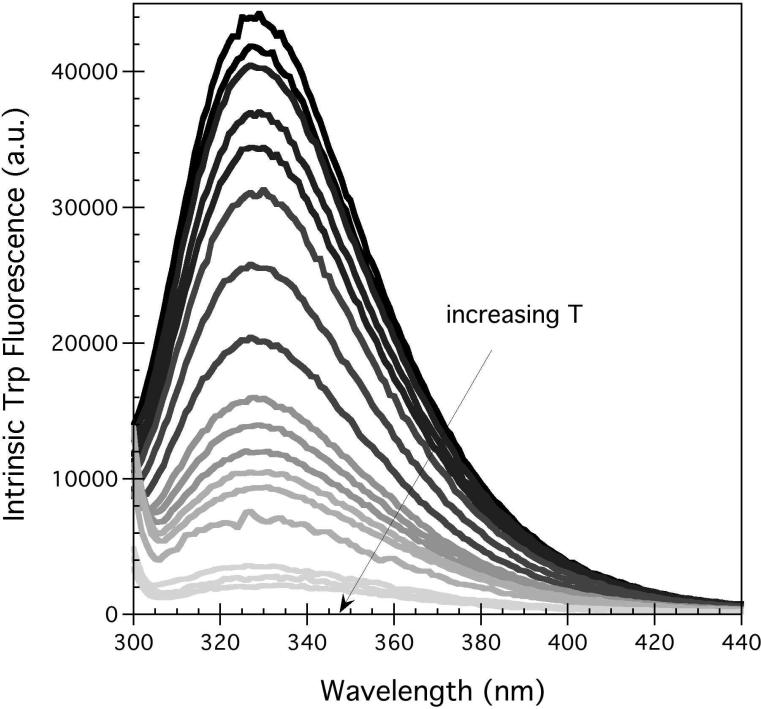
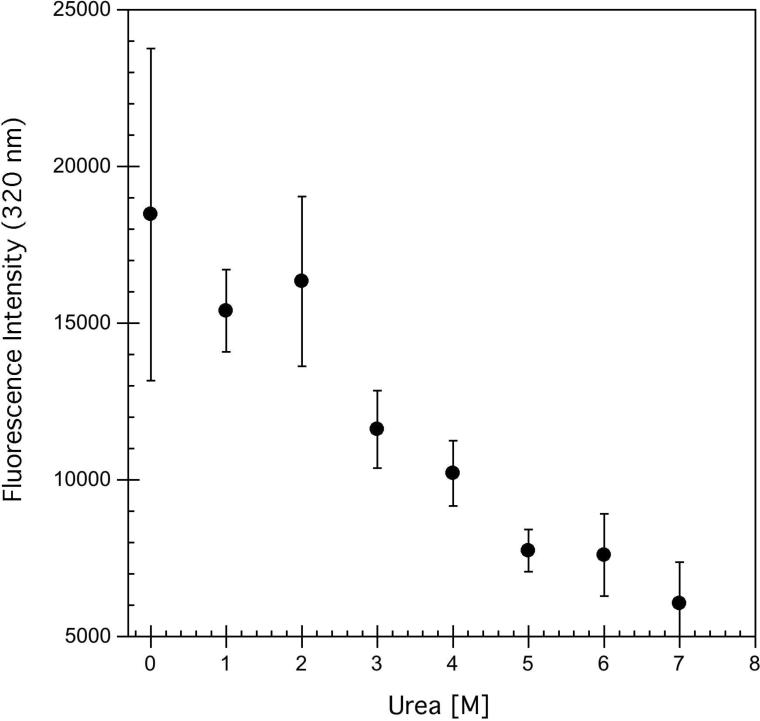
Figure 4.
A) Representative thermal unfolding CD spectra obtained for hA2aR-His10, with temperatures increasing from 5°C to 95°C, in 15°C increments, where lighter greys are higher temperatures. B) Tertiary structure changes monitored through intrinsic tryptophan fluorescence where an excitation wavelength of 290 nm was used. Spectra represent temperatures from 11°C to 79°C, in 8°C increments, where lighter greys are higher temperatures. C) Chemical unfolding of hA2aR-His10 as a function of increasing urea, as determined by intrinsic fluorescence intensity changes at 320 nm. Error bars represent the deviation from the average of two or more biological replicates.


