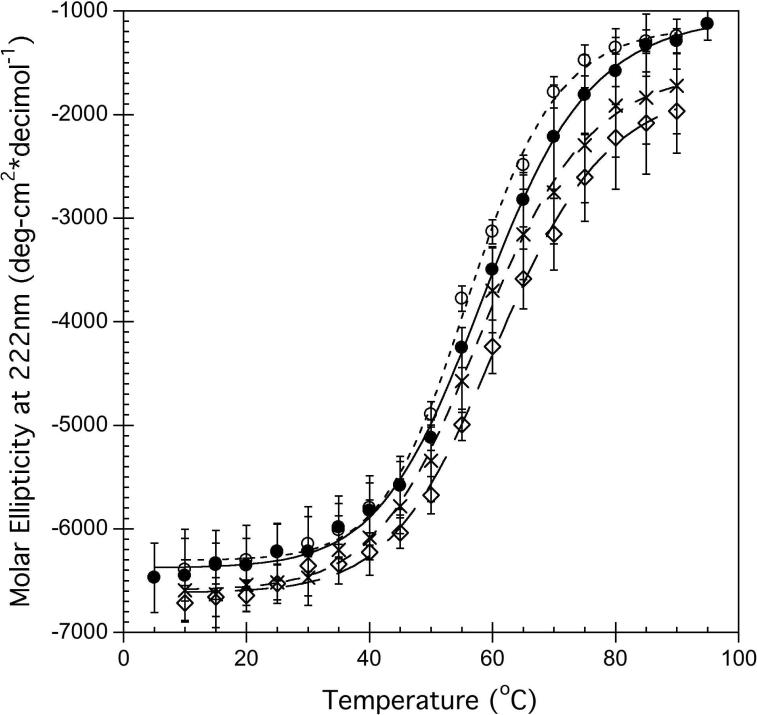
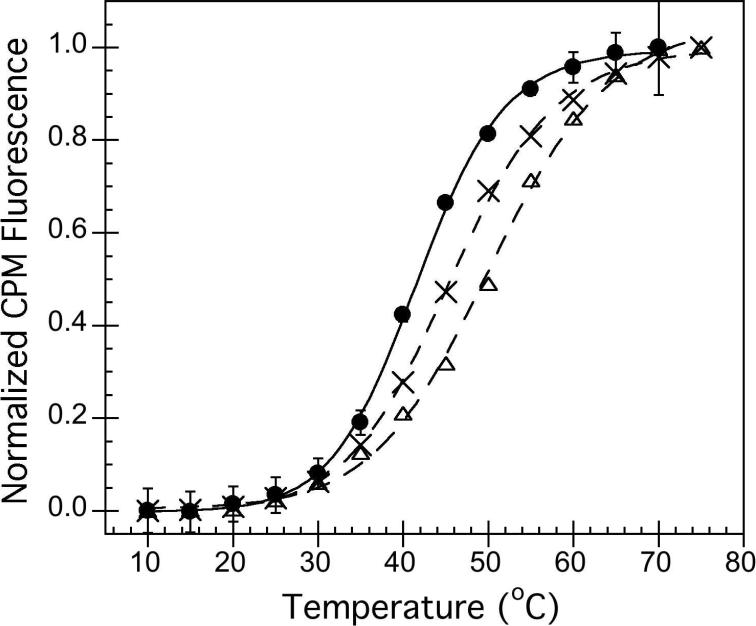
Figure 5.
Thermal unfolding of hA2aR-His10 monitored via CD at 222 nm (A) or via fluorescence intensity (463 nm) of a thiol-reactive fluorescent probe, CPM (B), for unliganded receptors (closed circles), receptors with 100 μM CHA agonist (open triangles), with 1000 μM theophylline antagonist (crosses), and reduced with 1 mM TCEP (open circles). Lines represent fit to a single-transition folding model for experimental data (points). Error bars represent standard deviation from the average of 3 or more trials. Note that CPM and TCEP are not compatible, as background fluorescence in the presence of TCEP was too large for detection of changes with temperature.


