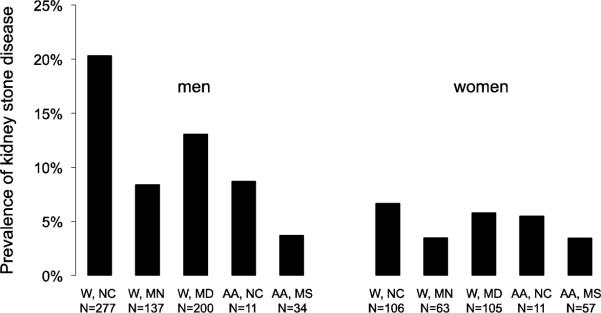
Figure 1. Prevalence of kidney stone disease by sex, race and ARIC study center.
Differences in sample size to the data presented in the tables occur because individuals with missing covariates were excluded from data presentation in the tables. Abbreviations: W: white; AA: African American; NC: North Carolina; MN: Minnesota; MD: Maryland; MS: Mississippi. N is the number of individuals with kidney stone disease.

