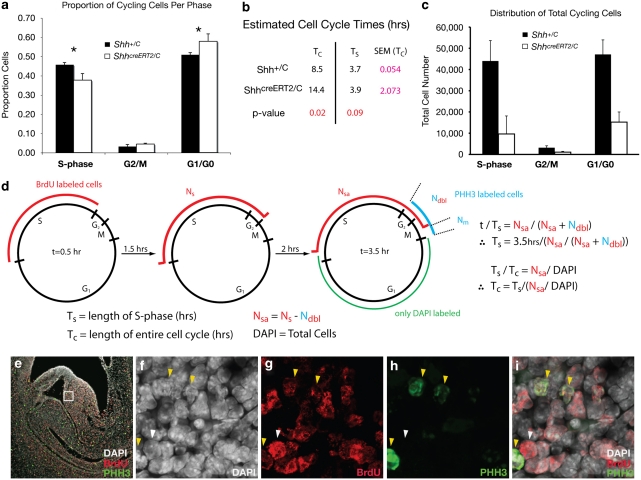
Figure 5. Shh controls growth of the genital tubercle by regulating cell cycle kinetics.
(a) Proportion of cells in each phase of the cell cycle. Labelling scheme groups G2 and M. Error bars show s.e.m., n = 3, * P<0.05. (b) Estimated cell cycle times for ShhcreERT2/C (mutant) and Shh+/c (control) embryos. Means are shown for mutant and control embryos and s.e. of the mean is provided for Tc. (c) Total cell number calculated for each phase of the cell cycle at E12.5. Error bars show s.e.m., n = 3. (d) Summary of cell labelling scheme used to determine lengths of S-phase (Ts) and total cell cycle (Tc). The red arcs refer to cell population labelled with BrdU, the blue arc refers to cell population labelled with phosphohistone-H3, and green arc refers to cell population labelled with only DAPI (arc lengths not to scale). (e) Sagittal section through genital tubercle of ShhC/+ embryo at E12.5 shown at ×10 magnification. White box depicts area of counting frame used for cell counts. (f–i) High magnification (×145), single channel (f–h) and merged (i) exposures of boxed area in (e) showing cells labelled with DAPI (white, panel f) BrdU (red, panel g), phosphohistone-H3 (green, panel h). Yellow arrowheads mark examples of cells positive for both PHH3 and BrdU, and the white arrowhead marks a cell positive for BrdU but negative for PHH3.

