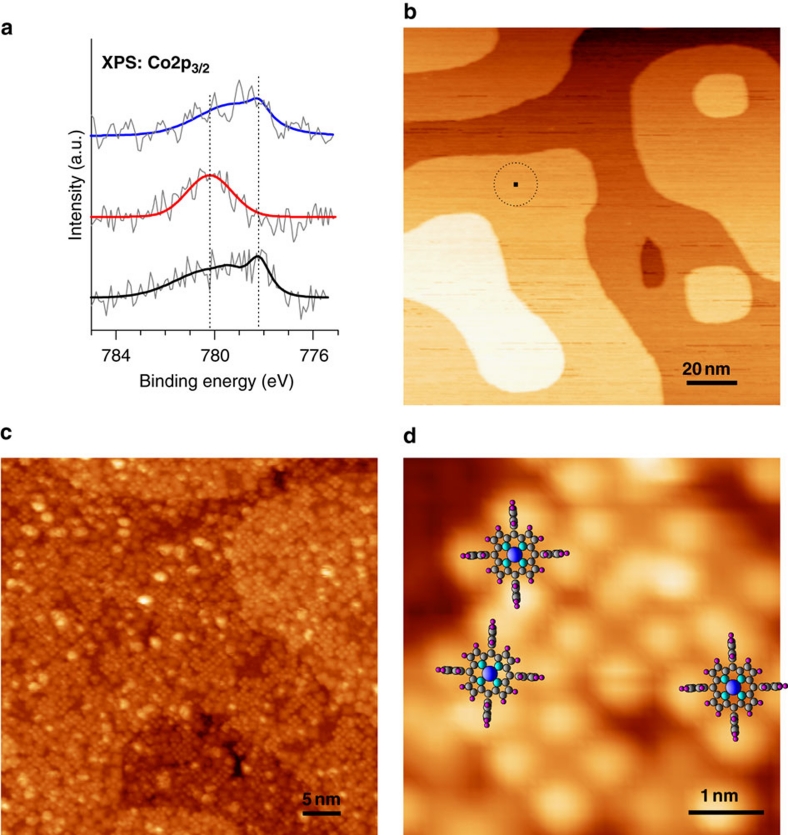
Figure 2. Probing electronic interaction and visualizing molecules on the surface.
(a) Co2p3/2 XP spectra (raw data and fitted curves) of CoTPP molecules (~1 ML) on Ni(001) before NO exposure (black line), after NO exposure (red line) and on desorption of NO (blue line). The spectral evolution reflects the NO-induced reversible switching of the Co oxidation state and the modified electronic interaction between CoTPP molecules and the Ni surface. Different binding energy positions of the Co2p3/2 XPS signal have been marked by dotted lines; 'a.u.' refers to arbitrary units. (b) Molecular adsorption on a reactive magnetic substrate: room temperature STM image showing the surface morphology of Ni(001) (150 nm × 150 nm; the size corresponding to one CoTPP molecule is depicted by the black square within the dotted circle). (c) Adsorption of CoTPP molecules on the Ni(001) surface (50 nm × 50 nm), where CoTPP is recognized by a four-leaf clover shape in symmetric and planar adsorption geometry while asymmetric conformations can also be detected38. (d) High-resolution STM: As a guide to the eye, molecular cartoons of CoTPP have been inserted (5 nm × 5 nm). Tunnelling parameters: I=0.07 nA, U=0.68 V (b) and I=0.05 nA, U=1.05 V (c, d).

