Figure 5.

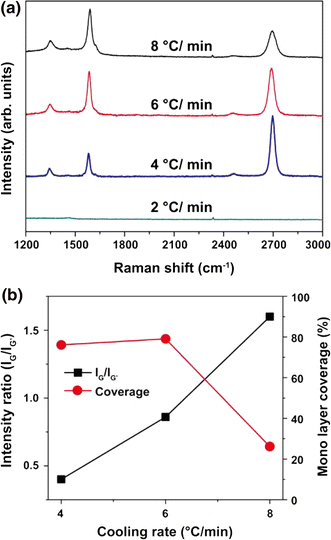
a Raman spectra of synthesized graphenes with different cooling rates. b Effects of cooling rates on both peak intensity ratio (IG/IG′) and areal coverage of monolayer graphenes

a Raman spectra of synthesized graphenes with different cooling rates. b Effects of cooling rates on both peak intensity ratio (IG/IG′) and areal coverage of monolayer graphenes