Figure 6.

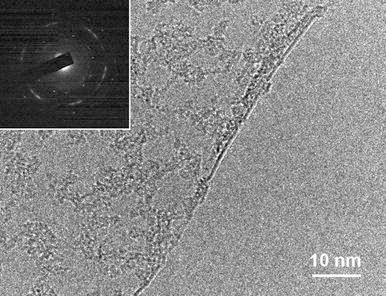
a A representative TEM image of mono layer graphene synthesized at 1,000°C with a 4°C/min cooling rate. The inset shows the electron diffraction pattern of the sample

a A representative TEM image of mono layer graphene synthesized at 1,000°C with a 4°C/min cooling rate. The inset shows the electron diffraction pattern of the sample