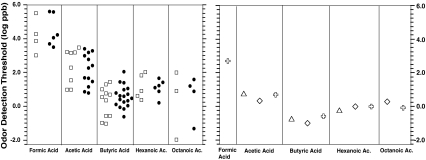
Fig. 6.
Left Showing the wide spread of odor detection thresholds reported for each carboxylic acid, as listed in the compilations by van Gemert (2003) (squares) and by Devos et al. (1990) (circles). Right Showing the similarity of odor detection thresholds for each carboxylic acid among three recent sources: the present study (crosses), Nagata (2003) (triangles), and Wise et al. (2007) (diamonds). Also note that the odor detection thresholds from these three studies appear at the low end of the range of values for each acid listed in the compilations (and shown on the left)

