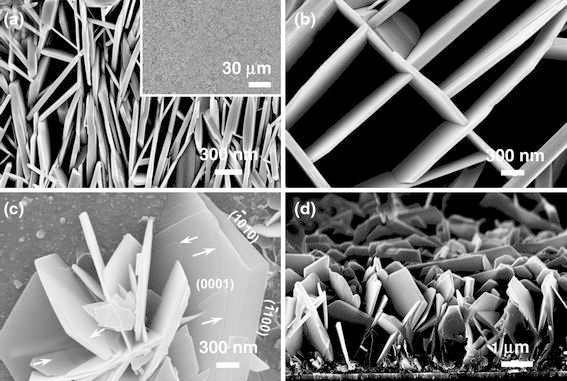
Figure 3.

SEM images of nanowalls electrodeposited with 0.1 M Zn(NO3)2·6H2O (mixed with 0.1 M KCl) on ITO–glass at 70°C at different stages of nanowall growth: a, b typical nanowall ledge surface obtained with 60-min deposition time, and c early stage of nanowall formation obtained with 1-min deposition time. d shows a cross-sectional SEM image of the growth of nanowalls directly on ITO–glass obtained with 5-min deposition time
