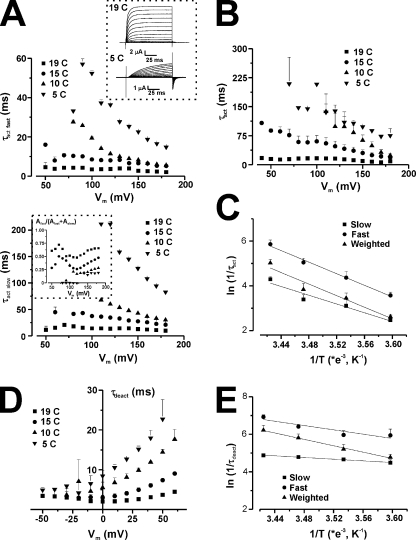
Figure 4.
Temperature and voltage dependence of the activation and deactivation kinetics of 4ILT. (A) Voltage dependence of τact at four temperatures, as indicated, for a typical oocyte expressing 4ILT. The top and bottom panels represent the fast and slow component of the activation, respectively. The error bars are the error on the fit. The top panel inset shows family of ionic current traces measured at 19 (top) and 5°C (bottom), for a typical oocyte expressing 4ILT (oocyte 3, 11/03/09). The bottom panel inset shows the proportion of the fast component (oocyte 2, 05/02/09). Averaged voltage dependence of the weighted τact (B) and τdeact (D) at four temperatures for 4ILT. Data from all the oocytes combined, each oocyte was tested for at least two temperatures. For τact, 19°C (n = 8), 15°C (n = 4), 10°C (n = 4), and 5°C (n = 3) and for τdeact, 19°C (n = 6), 15°C (n = 5), 10°C (n = 4), and 5°C (n = 4). In both cases, the internal solutions contained 120 mM K+; the external solutions contained 12 and 50 mM K+ for activation and deactivation, respectively. The error bars are the SEM. Arrhenius plot of the ln of rate of activation (ln(1/τact)) (C) at +180 mV and that of the rate of deactivation (ln(1/τdeact)) (E) at 0 mV for 4ILT. The slow (squares), fast (circles), and weighted (triangles) components are shown. For activation, the slopes and intercepts for a linear fit to the data were −9800 ± 1800 (s−1/K−1) and 38 ± 6 (s−1), −13000 ± 800 (s−1/K−1) and 50 ± 3 (s−1), and −12900 ± 2200 (s−1/K−1) and 49 ± 8 (s−1) for the three components, respectively. For deactivation, the slopes and intercepts for a linear fit to the data were −8500 ± 500 (s−1/K−1) and 35 ± 2 (s−1), −5700 ± 1600 (s−1/K−1) and 26 ± 6 (s−1), and −2200 ± 100 (s−1/K−1) and 12.6 ± 0.5 (s−1) for the three components, respectively. The activation energy (Eaf) for the forward transition was calculated from the slope (−Ea/R) at 19.5, 25.8, and 25.6 kCal/mol and that of the backward transition (Eab) at 16.9, 11.3, and 4.4 kCal/mol.

