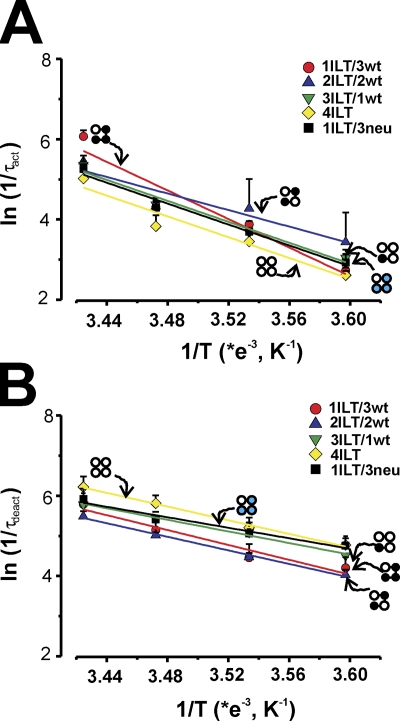
Figure 6.
Arrhenius plots of the forward and backward transition for the ILT heterotetramers. The ln(1/τact) (A) and ln(1/τdeact) (B) are plotted against 1/T (K−1). The slopes of the curve (−Ea/R), in which R is the gas constant (1.985 Cal·mol−1·K−1), are used to calculate Ea for each heterotetramer (see Table I). 1ILT/3wt (red circles), 2ILT/2wt (blue up triangles), 3ILT/1wt (green down triangles), 4ILT (yellow diamonds), and 1ILT/3neu (black squares). Data for activation were taken at +70, +60, +150, +180, and +100 mV for 1ILT/3wt, 2ILT/2wt, 3ILT/1wt, 4ILT, and 1ILT/3neu, respectively, and at +60, +10, 0, 0, and +30 mV for deactivation for 1ILT/3wt, 2ILT/2wt, 3ILT/1wt, 4ILT, and 1ILT/3neu, respectively.

