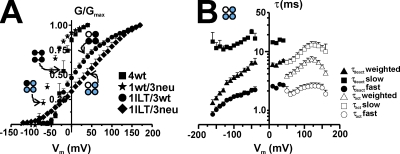
Figure 7.
Conductance and kinetics of the single voltage sensor Shaker ILT. (A) Normalized G-V curve for the single voltage sensor Shaker ILT. Data from 4wt (squares), 1wt/3neu (stars), 1ILT/3wt (circles, n = 7), and 1ILT/3neu (diamonds, n = 4) are shown. The ones from 4wt and 1wt/3neu were taken from Gagnon and Bezanilla (2009). The internal and external solutions contained both 120 mM K+, respectively. (B) Kinetics of activation (τact, open symbols) and deactivation (τdeact, filled symbols) of 1ILT/3neu measured at room temperature. The slow (squares), fast (circles), and weighted (top triangles) components are shown. In both cases, the internal solutions contained 120 mM K+; the external solutions contained 12 and 50 mM K+ for activation and deactivation, respectively.

