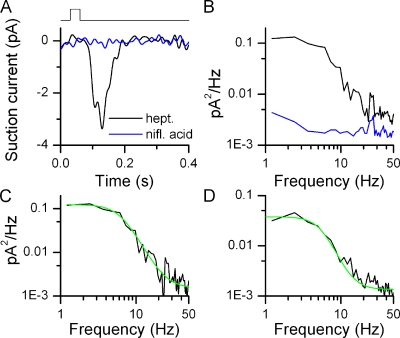
Figure 3.
Kinetics of small odorant responses. (A) Suction pipette recordings from an I7-expressing ORN. Black trace is the average of 10 responses to 30-ms stimulations at 0.3 µM heptanal. Blue traces are the average of 10 recordings in the presence of 300 µM niflumic acid (no odorant) to suppress basal noise. The recording bandwidth of the displayed traces was 0–50 Hz. (B) Power spectrum analysis of corresponding traces (filtered at DC-5000 Hz) from A. Similar results in 12 ORNs. (C) Difference of the power spectra (odorant minus niflumic acid) in B fitted with A2 + (A1 − A2)/(1 + (f/f0)n), with A1 = 0.13 pA2Hz−1, A2 = 0.001 pA2Hz−1, f0 = 6.4 Hz, and n = 3.4. (D) Difference of the power spectra (basal noise minus niflumic acid) in Fig. 2 C obtained from basal noise. Fitting parameters are A1 = 0.04 pA2Hz−1, A2 = 0.001 pA2Hz−1, f0 = 5.6 Hz, and n = 3.7.

