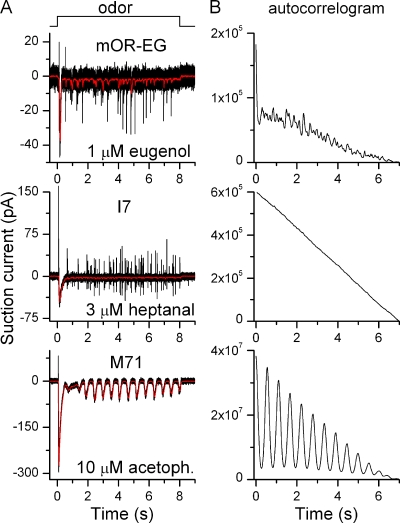
Figure 6.
The odorant receptor determines response patterns during prolonged stimulation. (A) mOR-EG, M71, and I7-expressing ORNs were exposed to their respective ligands for 8 s at concentrations indicated next to each trace. Black and red recordings were filtered at DC-5000 Hz and DC-50 Hz, respectively. (B) The traces in A were auto-correlogrammed from 1–8 s to reveal underlying preferred response periodicities.

