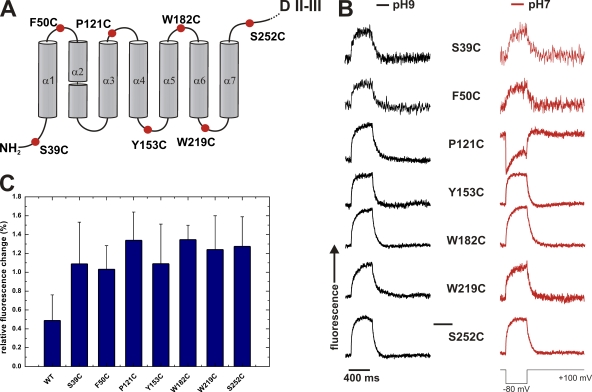
Figure 2.
FRET signals of Cry1Aa mutants. (A) Position of cysteine mutants of domain I. Mutants in every loop were investigated except the α2–α3 loop, as mutants in this loop did not express. (B) Fluorescence traces (TMR) of the mutants in A. Fluorescence traces were taken for a hyperpolarizing pulse (+100 mV/−80 mV/+100 mV) at pH 9.0 (black traces) and after exchange to pH 7.0 (red traces). (C) Relative fluorescence changes (dF/F; mean ± SD) of the cysteine mutants in A.

