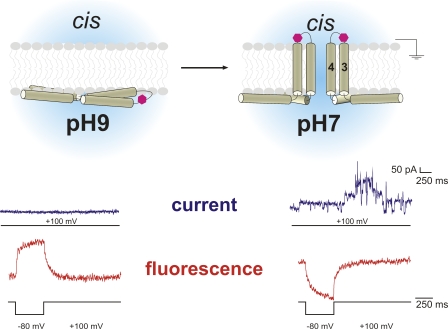
Figure 3.
Translocation of the α3–α4 hairpin. Results for the T122C-R131E mutant. The fluorophore translocates through the membrane upon activation by pH change. The fluorescence signal (red) reverses as a response to a negative pulse (+100 mV/−80 mV/+100 mV), and pore formation is observed after pH change. Pore formation (blue, 100 mV) is observed only at pH 7.0. Considering that the other positions are located at the intracellular leaflet, we suggest a model for pore formation as depicted here (top). The entire domain I translocates to the internal leaflet. Subsequently, helices α3 and α4 reach through the membrane and form the ion-conducting pore from the internal side. The magenta hexagon depicts the fluorophore attached to the α3–α4 loop. Two toxins are shown on the right as it is thought that toxins oligomerize for pore formation. Please note that the pulse protocols for the current and fluorescence traces are not identical. Currents are shown only from +100 mV.

