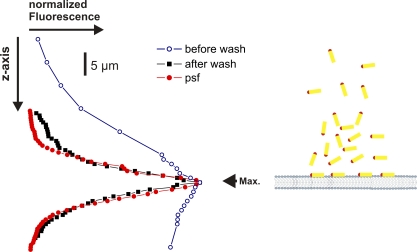
Figure 4.
Confocal z-scan of labeled toxin in the bilayer. Confocal z-scans through a bilayer after incubation with labeled toxin. The fluorescence was concentrated to the bilayer after rigorous washing of the toxin as described in the Materials and methods. In red, the “point spread function” (psf) is shown. It was determined with a 1-µm fluorescent bead.

