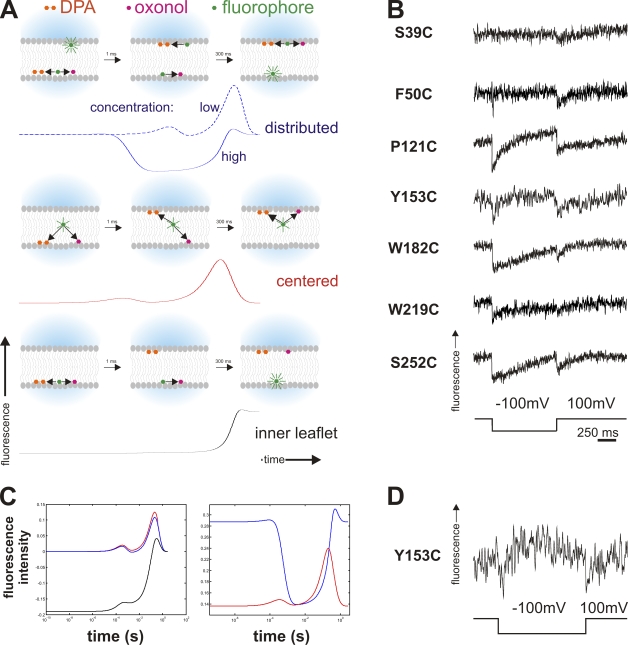
Figure 5.
Double FRET experiments. (A) Timeline of double FRET in response to a hyperpolarizing pulse. Depicted are the principle states (as cartoons) and respective simulated fluorescence double FRET signals below for high acceptor concentration for the instances where the fluorophores are distributed between the two leaflets (top), located close to the center (center), or located in just one leaflet (bottom). Black arrows indicate energy transfer between toxin (fluorophore) and acceptor (oxonol and DPA) for close or medium distance. While in the centered case, the fluorescence will show two transients (on a logarithmic scale) during the movement of the acceptors, distributed toxins will lead to a transient fluorescence decrease while fluorophores on both sides are transferring energy to oxonol or DPA. A fluorophore located on only one side will lead to a monotonous increase as the acceptors move away. For distributed donors, the fluorescence response for low acceptor concentrations is shown as a dashed line for comparison (see text for details). (B) Results of the double FRET experiments for the cysteine mutants (Fig. 2 A). The traces show a double-negative transient as a response to a depolarizing pulse. (C) Simulated fluorescence response (semi-logarithmic scale) of toxins located close to the center (red), distributed between both leaflets (blue), and located on only one side (black) for a low (6,400 acceptors/µm2, left) and high (22,300 acceptors/µm2, right) concentration in response to a hyperpolarizing pulse. The negative transient in the fluorescence response for distributed toxins occurs only at high concentrations. (D) Trace of double FRET of Y153C where negative and positive transients are visible. This occurs at intermediate acceptor concentrations.

