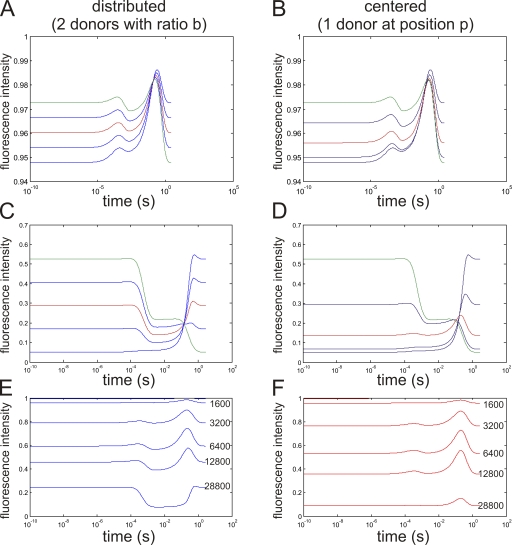
Figure 8.
Simulated double FRET responses. Simulated fluorescence traces (semi-logarithmic scale) for donors distributed between both leaflets (A, C, and E) and donors located at a fraction p of the membrane (B, D, and F). (A and B) Concentration of 1,600 acceptors/µm2 with a distribution between both leaflets of b/(1 − b) or located at a position p in the bilayer. The red curve indicates b = 0.5 (equal distribution) or p = 0.5 (center of the bilayer), respectively. (C and D) Same as A and B, but with a concentration of 22,300 acceptors/µm2. (E and F) b or p = 0.5, with increasing concentrations x acceptors/µm2 (x as indicated).

