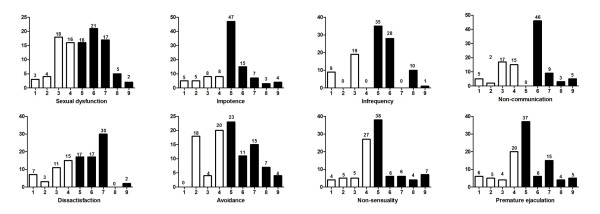
Figure 1.
Scores of sexual dysfunction in 102 studied patients according to GRISS questionnaire. Graph shows the distribution of scores (from 1 to 9 on the x- axis) for each GRISS subscale, with the number of patients (y-axis) above each score. Normal scores range from 1-4 and abnormal scores are 5-9.

