Figure 1.
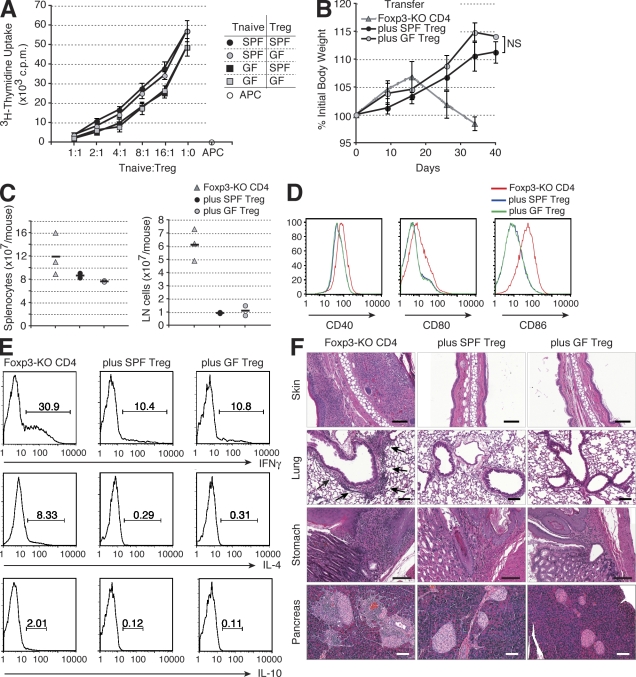
The suppressor activity of T reg cells from SPF and GF mice is comparable. (A) In vitro suppressor activity of sorted SPF and GF CD4+Foxp3+ T reg cells was assessed by [3H]thymidine incorporation in co-cultures with SPF and GF CD4+Foxp3−CD62LhighCD44low naive T cells (Tnaive) and irradiated T cell–depleted SPF splenocytes (APC) in the presence of anti-CD3. The data are representative of two independent experiments. (B) Analysis of the body weight of Tcrb−/−Tcrd−/− recipients of effector CD4+ T cells from Foxp3− mice alone (Foxp3-KO CD4) or together with T reg cells from SPF (plus SPF T reg) or GF (plus GF T reg) mice (n = 6 per group). (A and B) Error bars represent SD. (C) Spleen and LN cellularity of Tcrb−/−Tcrd−/− mice 35 d after the transfer of the indicated cell subsets. The horizontal bars indicate the mean values for each group. (D and E) Flow cytometric analyses of splenocytes of Tcrb−/−Tcrd−/− mice 35 d after the transfer of effector CD4+ T cells from Foxp3− mice with or without SPF or GF T reg cells. Two mice per group were analyzed in two independent experiments, and representative data are shown. The surface expression of the indicated co-stimulatory molecules on B cells (D) and the frequencies of the cytokine-producing cells among CD4+Foxp3− cells determined by flow cytometry after T cell stimulation with anti-CD3 and anti-CD28 (E) are shown. (F) Representative histopathology of the Tcrb−/−Tcrd−/− mice 35 d after the transfer of the indicated cell subsets. Inflamed area of the lung is marked by arrows. Bars, 100 µm.

