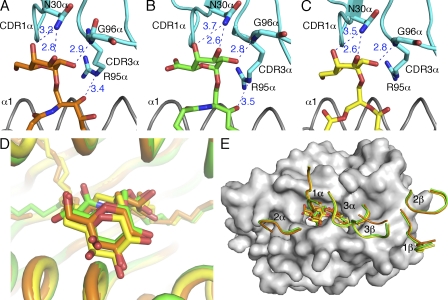
Figure 4.
Interactions of the TCR with mCD1d-presented glycolipids. (A–C) H-bond interactions between the mCD1d-bound glycolipids and the TCR are depicted as blue dashed lines with distances labeled in angstroms. The CDR1-α and CDR3-α regions are shown in cyan. α-GalCer is shown in orange; GalA-GSL is shown in green; BbGL-2c is shown in yellow. The side chains of residue N30-α, G96-α, and R95-α that make contact with the glycolipids are shown. (D) Comparison of the glycolipids in the ternary complex structures after superimposition. Glycolipids are shown in sticks. (E) Comparison of footprints of the TCR on the surface of mCD1d. CDR loops are labeled and colored identically to the glycolipids. Note that the H bond between the 4′ OH of GalA-GSL and N30-α is 3.7 Å, which slightly exceeds the maximal distance (3.5 Å) for typical H bonds.

