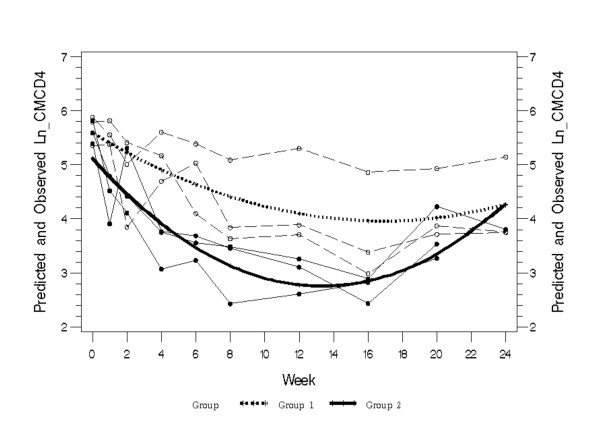
Figure 5.
Comparison of central memory CD4+ T cells in intrarectally-infected and intravenously-infected pig-tailed macaques. Individual data points from intrarectally-infected animals (thin dotted lines with open symbols) with the predicted mean value (thick dotted line; Group 1) were compared with data from intravenously-infected animals (thin solid lines with closed symbols) with the predicted mean value (thick solid line; Group 2). Significant differences were found at all time points from week 1 through week 20. P-values for all time points (0, 1, 2, 4, 6, 8, 12, 16, 20, 24) are given here: 0.0528, <0.0001, <0.0001, <0.0001, <0.0001, <0.0001, 0.0003, 0.0009, 0.0585 and 0.9761 respectively.

