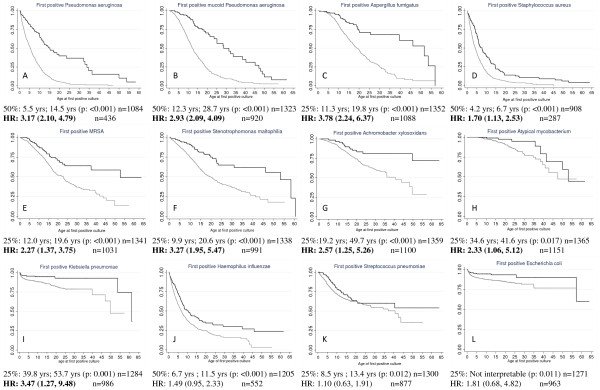
Figure 1.
Unadjusted Kaplan-Meier (K-M) plots for 12 of 13 infectious organisms studied. Gray lines represent 'Minimal' CFTR function subjects and black lines represent subjects with 'Residual' CFTR function. There are differing numbers of subjects used in each plot due to the inclusion criteria of having a previous negative culture prior to the first positive culture for the particular organism. Median age differences are presented for those infections not affected by censoring, otherwise ages corresponding to the point where 25% of the population is affected is presented. Corresponding t-tests for the unadjusted K-M and Cox proportional hazard ratios with 95% confidence interval adjusted for the FEV1BeforeInfx and the number of cultures per subject per year are presented. A. Pseudomonas aeruginosa. B. mucoid Pseudomonas aeruginosa. C. Aspergillus fumigatus. D. Staphylococcus aureus. E. Methicillin-resistant Staphylococcus aureus. F. Stenotrophomas maltophilia. G. Achromobacter xylosoxidans. H. Atypical mycobacterium. I. Klebsiella pneumoniae. J. Haemophilus influenzae. K. Streptococcus pneumoniae. L. Escherichia coli. Burkholderia cepacia complex is not presented as few subjects developed this infection and results were limited in interpretation.

