
Figure 2.
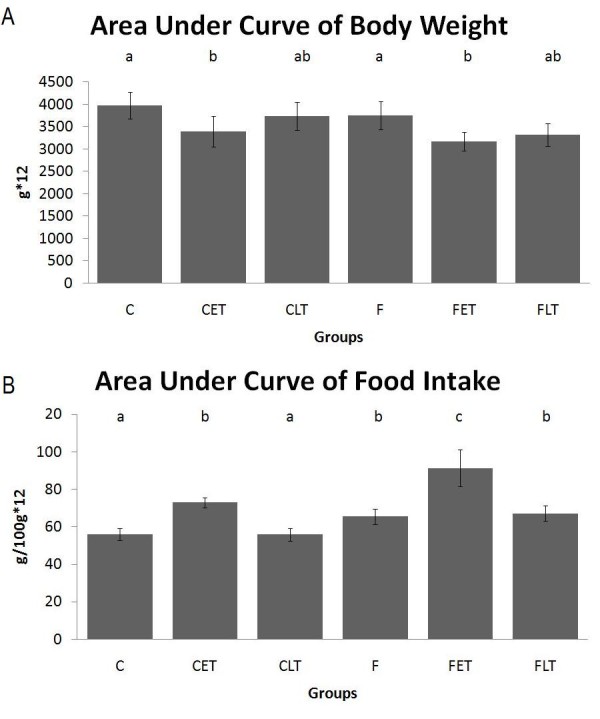
(A) Area under body weight curve and (B) area under food intake curve of the animals during 12 weeks calculated by the trapezoidal method. Results are expressed as the mean and standard deviation of eight animals per group. Results are expressed as the Mean ± SD. n = 8; C = Control Sedentary, CET = Control Early Trained, CLT = Control Late Trained, F = Fructose Sedentary, FET = Fructose Early Trained and FLT = Fructose Late Trained. Different letters indicate different values among groups (p ≤ 0.05).