
Figure 3.
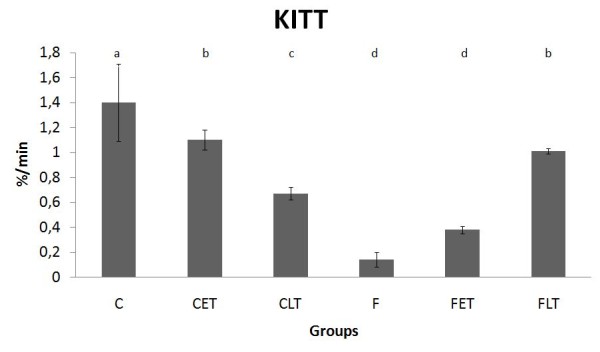
Serum glucose disappearance rate (Kitt) during the insulin tolerance tests (ITT) at the end of the experiment. Results are expressed as the Mean ± SD. n = 8; C = Control Sedentary, CET = Control Early Trained, CLT = Control Late Trained, F = Fructose Sedentary, FET = Fructose Early Trained and FLT = Fructose Late Trained. Different letters indicate different values among groups (p ≤ 0.05).