
Figure 4.
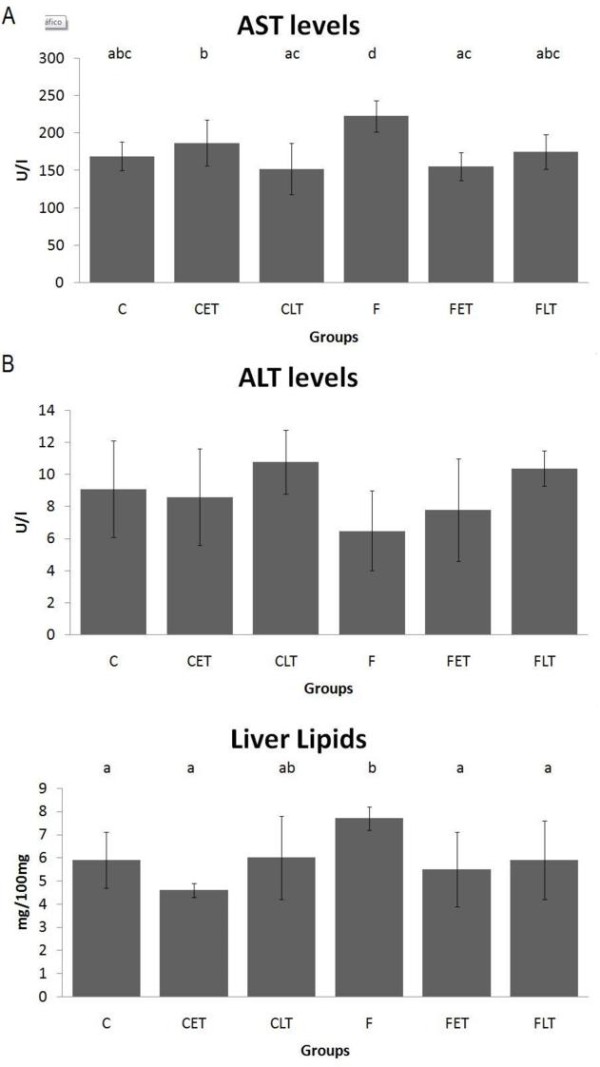
(A) Serum Aspartate Aminotransferase [AST], (B) Serum Alanine Aminotransferase [ALT] and (C) liver lipids levels at the end of experiment. Results are expressed as the Mean ± SD. n = 8; C = Control Sedentary, CET = Control Early Trained, CLT = Control Late Trained, F = Fructose Sedentary, FET = Fructose Early Trained and FLT = Fructose Late Trained. Different letters indicate different values among groups (p ≤ 0.05).