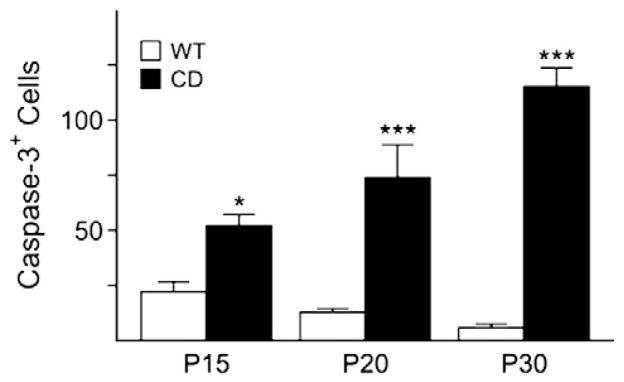
Fig. 7.
CD mice exhibit and increase in cell death. Cell counts for caspase-3 positive cells confirm an increase at P15, P20 and P30. Bar graph is the mean±SEM of 3 animals/group. (*P<0.05; ***P<0.001, one-way ANOVA followed by Bonferroni’s multiple comparison test; WT=empty columns, CD=filled columns).

