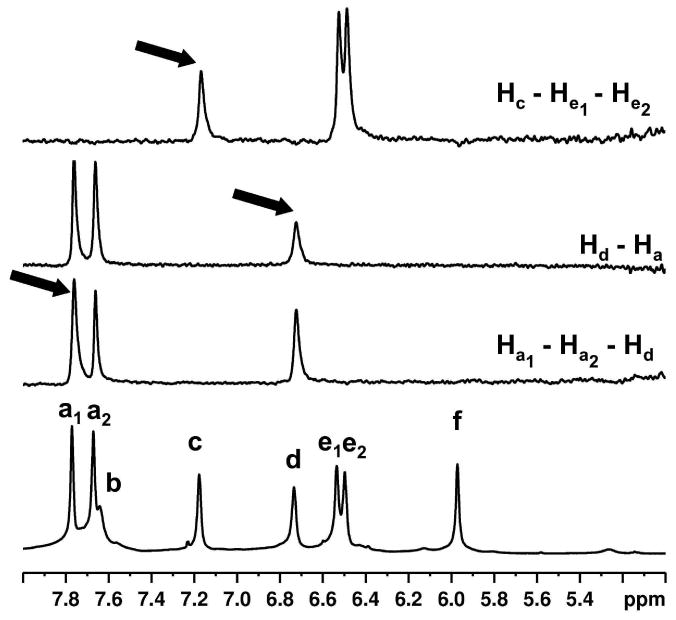
Figure 4.

Partial 1D selective TOCSY NMR spectra (500 MHz, 298 K, D2O, 0.12 s mixing time) of 1b@OA2 complex (5 × 10⁻³ M OA and 5 × 10⁻² M Na2B4O7) showing OA signals. Signal that is being irradiated is marked with an arrow. Observed TOCSY correlations (Hc – He, Hd – Ha and Ha – Hd) are shown in the right.
