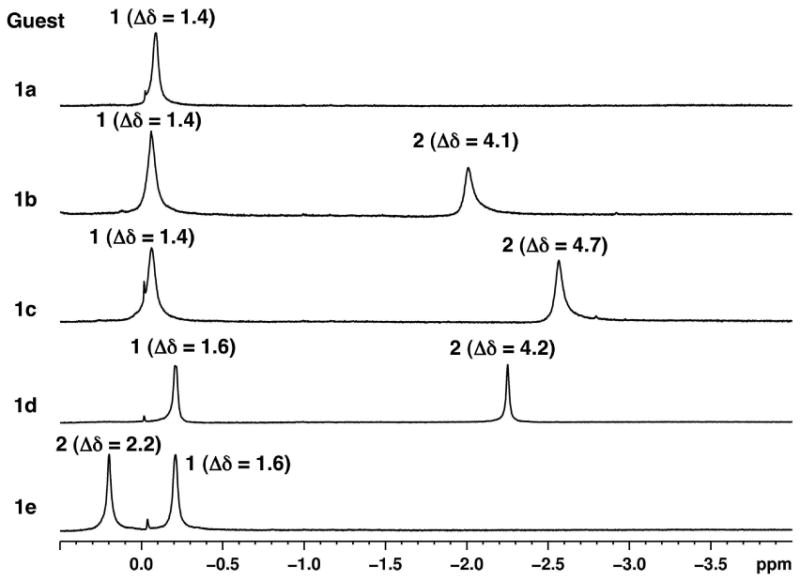
Figure 7.

Selected regions of the 1H NMR spectra (500 MHz, D2O, 5 × 10⁻³ M OA and 5 × 10⁻² M sodium tetraborate) showing the aliphatic regions of OA complexes of 1a, 1b, 1c, 1d and 1e. Methyl groups of the chiral auxiliary and of the pyridone ring are labeled 1 and 2 respectively as shown in each figure. Change in chemical shift upon binding to OA with respect to the NMR spectrum recorded in CDCl3 (Δδ) is also shown for each signal.
