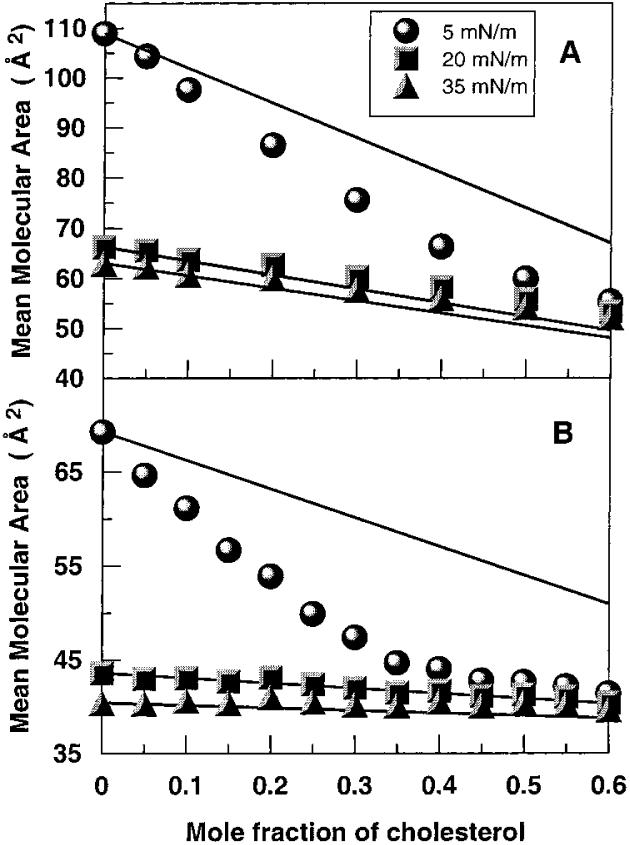
Figure 4.
Mean molecular area vs composition analyses: (A) N-14:0 DMPE and (B) DMPE. Data are shown at 5, 15, and 35 mN/m. Experimental data are indicated by symbols. The solid lines represent theoretical additive behavior calculated from the response of the pure lipids as described in Materials and Methods. Because the theoretical binary mixtures are apportioned by mole fraction, the response is linear.

