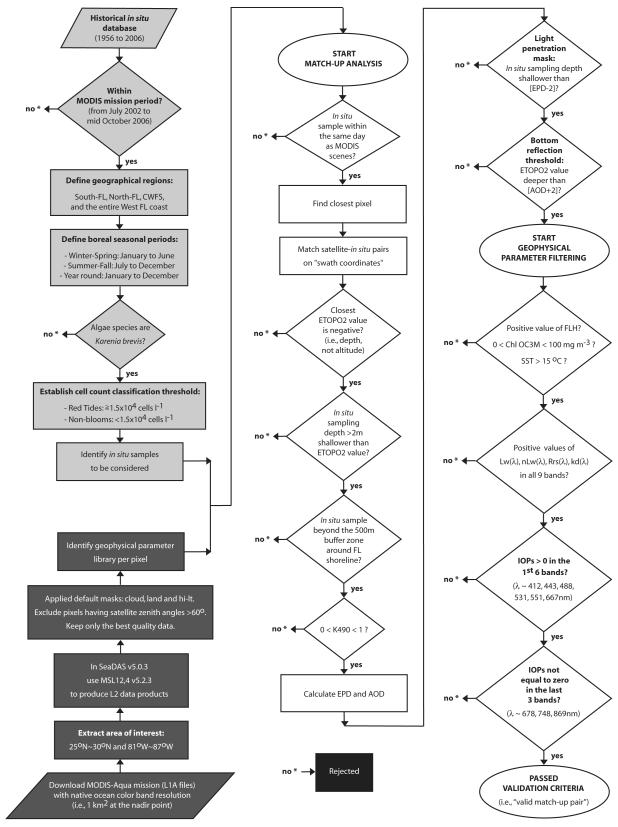
Figure 2.
Flowchart representing the stringent quality control tests applied to all near-coincident satellite-in situ pairs; adapted from Carvalho (2008) and Carvalho et al. (2010). Steps to identify in situ samples to be considered (light gray); satellite processing to identify the geophysical parameter library (dark gray); level-by-level of the match-up analysis performed to derive the valid cloud-free match-ups (white); and data removed from the analysis (black). As the water column depth was not specified for the in situ sampling within the Florida HAB Historical Database provided by the Florida Fish and Wildlife Conservation Commission’s Fish and Wildlife Research Institute (Haverkamp et al., 2004), the Earth TOPOgraphy database at two-minute gridded resolution (ETOPO2 – http://www.ngdc.noaa.gov/mgg/gdas/gd_designagrid.html#) was used. Refer to Figure 6.3 in Carvalho (2008) for graphical representation of effective penetration depth (EPD; Gordon and McCluney; 1975) and apparent optical depth (AOD; Bailey and Werdell, 2006). Inherent optical properties (IOPs) includes: a(λ), aph(λ), adg(λ), b(λ), bbp(λ). For additional and information see Section 2.

