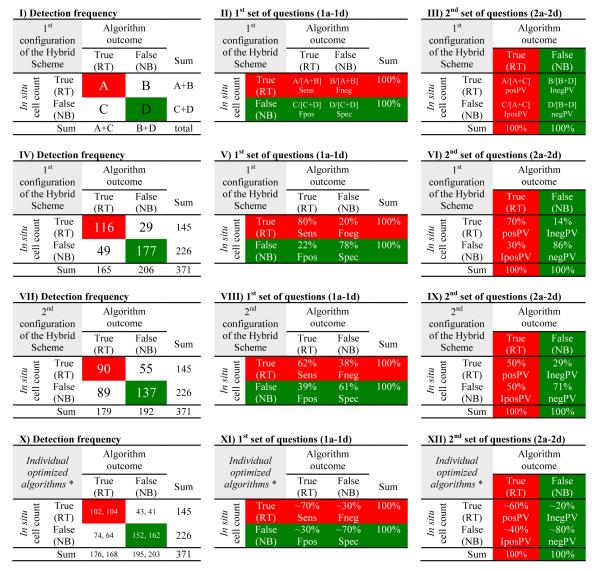
Table 1.
Detection frequency of the Hybrid Scheme along the Central West Florida Shelf during the Summer-Fall periods (2002 to 2006). Panels I-II: Error matrices (use Table 2 for assistance with A, B, C, and D); Panels IV-VI: 1st configuration of the Hybrid Scheme (when either or both algorithms needed to flag known samples correctly; see Figure 3); Panels VII-IX: 2nd configuration of the Hybrid Scheme (when both algorithms must have flagged simultaneously known samples correctly; see Figure 3); Panels X-XII: Individual versions of the Empirical Approach and the Bio-optimal Technique, respectively (* adapted from Table 6 in Carvalho et al. (2010)). Panels II, V, VIII, and XI take into account the rows of the table and are based on the number of a priori known in situ samples (i.e., “in situ cell count”), where the RED indicates red tide samples (≥1.5×10⁴ cells l−1) and the GREEN indicates non-blooming conditions (<1.5×10⁴ cells l−1); these panels answer the first set of questions (Section 3: 1a-1d): sensitivity (Sens; A/[A+B]; Question 1a), false negative (Fneg; B/[A+B]; Question 1b), false positive (Fpos; C/[C+D]; Question 1c), and specificity (Spec; D/[C+D]; Question 1d). Panels III, VI, IX, and XII take into account the columns and are based on the identifications in the satellite data (i.e., “algorithm outcome”), where the RED indicates samples flagged as HAB-positive and the GREEN indicates samples classified as HAB-negative; these panels answer the second set of questions (Section 3: 2a-2d): positive predictive value (posPV; A/[A+C]; Question 2a), inverse of the positive predictive value (IposPV; C/[A+C]; Question 2b), inverse of the negative predictive value (InegPV; B/[B+D]; Question 2c), negative predictive value (negPV; D/[B+D]; Question 2d). For an ideal algorithm, B=C=0.

|
