
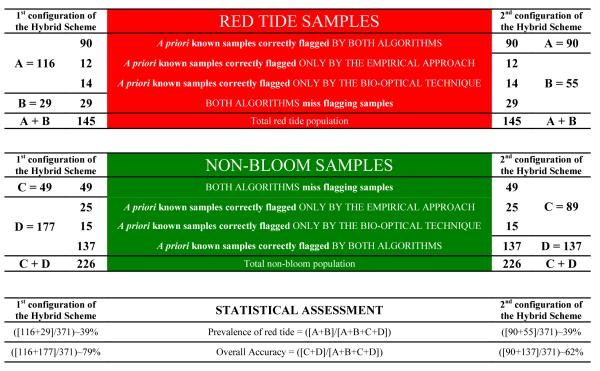
Table 2.
Detection frequency of the Hybrid Scheme: 1st configuration (Left) and 2nd configuration (Right). The RED shows the incidence of red tides (n=[A+B]; samples containing ≥1.5 x10⁴ cells l−1), and the GREEN shows non-blooming conditions (n=[C+D]; samples containing <1.5x10⁴ cells l−1). Use error matrices in Table 1 [panels I, IV, and VII] and Venn diagrams in Figure 3 to assist with the interpretation and for the use of A, B, C and D to access the accuracy of the Hybrid Scheme.
|
A = A priori known red tide samples correctly flagged as HAB-positive.
B = A priori known red tide samples incorrectly flagged as HAB-negative
C = A priori known non-bloom samples incorrectly flagged as HAB-positive
D = A priori known non-bloom samples correctly flagged as HAB-negative