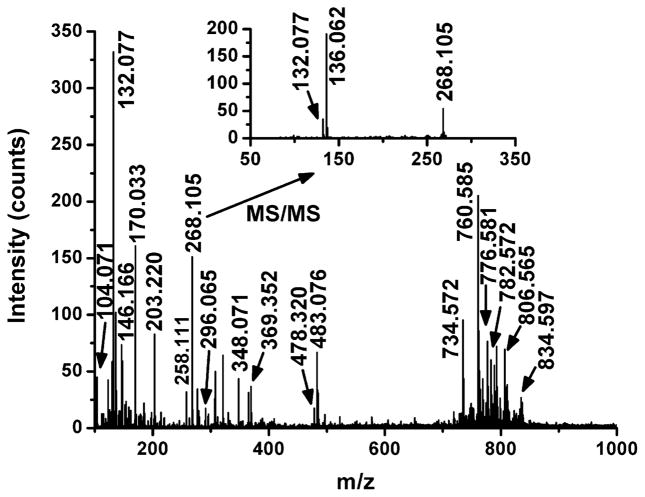
Figure 1.
Positive-ion LAESI mass spectrum from a selected pixel of a coronal rat brain section. The inset shows the CAD-induced tandem mass spectrum of the m/z 268.105 ion. The fragment ion at m/z 136.062 is consistent with protonated adenine, [C5H5N5 + H]+, (m/z 136.062, theoretical) within 1 ppm mass accuracy.

