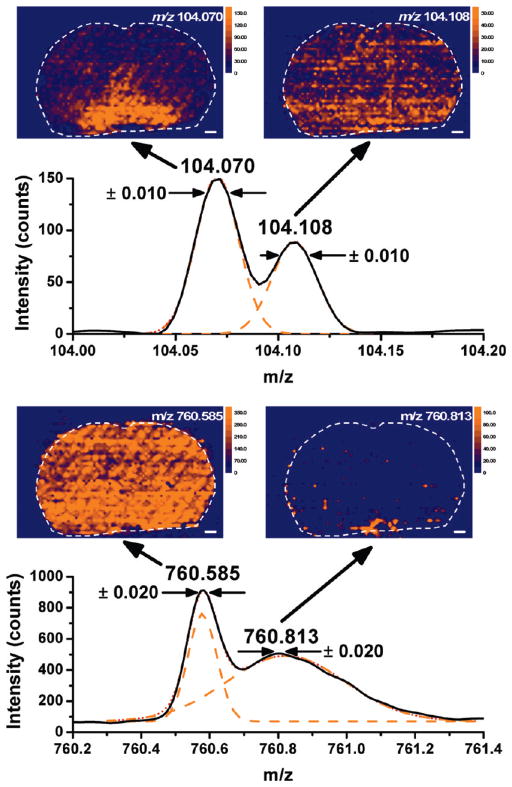
Figure 3.
High mass resolving power enabled the separate imaging of positively charged species with identical nominal mass. The m/z values for the γ-aminobutyric acid (m/z 104.070) and choline (m/z 104.108) ions differed by only 38 mDa, whereas the PC(34:1) (m/z 760.585) and the multiply charged α-1 chain of the rat hemoglobin (m/z 760.813) were separated by 228 mDa. Deconvolution of these peaks (solid black line) enabled us to render the separated species (orange lines) into distinct images.

