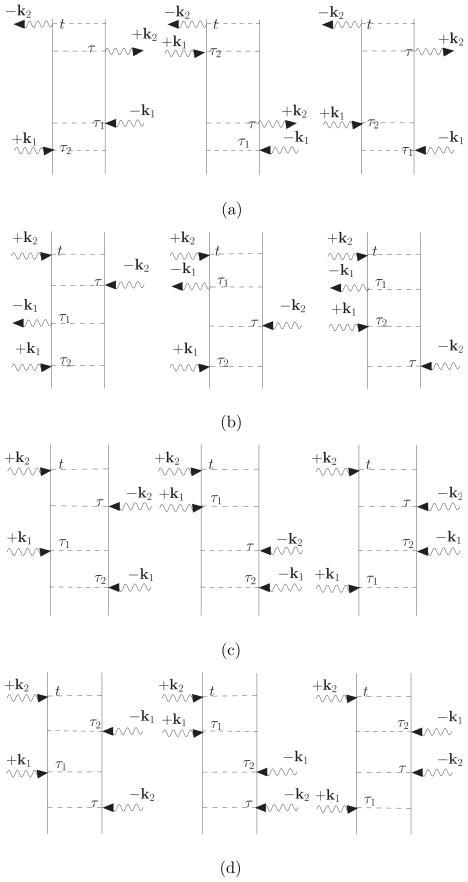
FIG. 5.
The Double sided Feynman diagrams resulting from Fig. 4 upon breaking the loops into time ordered contributions. Panel (a) – (d) are the time ordered diagrams corresponding to the loops shown in panel (a) – (d) of Fig. 4, respectively. Since the four loops with three interactions on the bra (Fig. 4, panels (e) – (h)) are already fully-time ordered, each gives a single double sided diagram. These are not repeated here. Overall, the eight loop diagrams of Fig. 4 yield 16 Feynman diagrams.

