
Figure 1. Enhanced miR-24 level in TSCC.
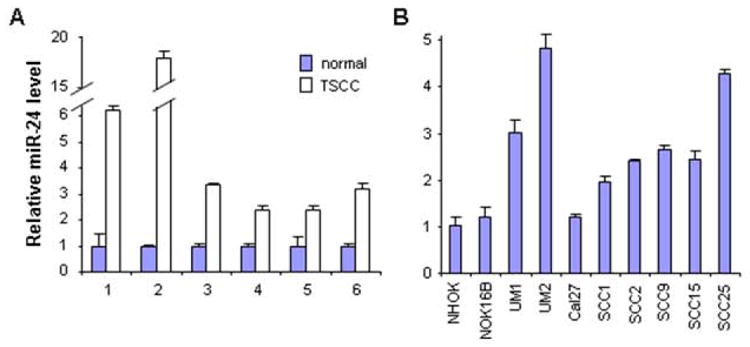
The qRT-PCR was performed to assess the miR-24 level in: (A) TSCC and their normal control tissue samples, and (B) a panel of TSCC cell lines, and an immortalized non-tumorgenic cell lines (NOK16B), and normal oral keratinocyte cell culture (NHOK). Statistically significant increases in miR-24 levels were observed for the paired tissue samples (p < 0.05). For the TSCC cell lines tested, up-regulation in miR-24 levels were observed in 7 of the 8 TSCC cell lines when compared to NHOK or NOK16B (p < 0.05).