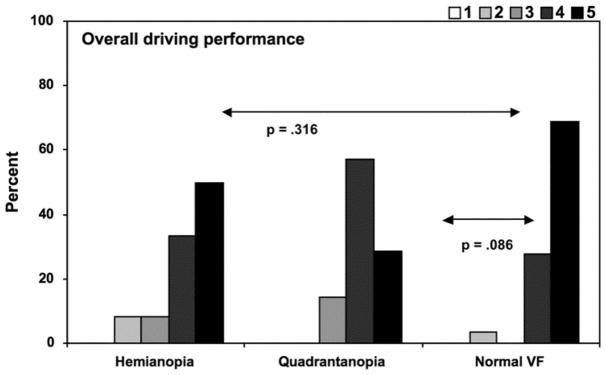
Figure 2.
Interstate driving: Percent of each group rated by the occupational therapist as 1 through 5 for overall driving performance. 1 = terminate the drive, 2 = unsafe driving, 3 = unsatisfactory driving, 4 = a few minor errors, 5 = no obvious errors. See text for further explanation. Group comparisons indicated by horizontal lines labeled with p-values. Some participants did not go on the interstate if they did not typically drive on the interstate or the therapist did not allow interstate driving based on non-interstate driving performance.

