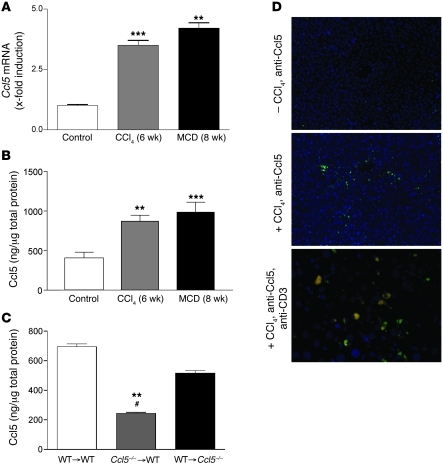
Figure 2. Association of Ccl5 with experimental liver fibrosis in mice.
(A) Ccl5 mRNA expression is significantly increased in total livers of mice treated with either CCl4 for 6 weeks or the MCD diet for 8 weeks (**P < 0.01, ***P < 0.001). (B) The increased expression of Ccl5 is also evident in the protein levels in both models of liver injury (**P < 0.01, ***P < 0.001). (C) Ccl5 protein content is significantly reduced in WT mice that received bone marrow from Ccl5–/– mice (Ccl5–/– → WT) after CCl4 challenge compared with that of WT mice that received WT bone marrow (WT → WT) (**P < 0.01) or Ccl5–/– mice transplanted with WT bone marrow (WT → Ccl5–/–) (#P < 0.05), suggesting that hematopoietic cells are the main source of Ccl5 during CCl4-induced liver fibrosis. (D) Immunohistochemical detection of Ccl5 in the murine liver shows only faint staining in normal liver (original magnification, ×100 [top panel]). The expression of Ccl5 is predominantly increased around blood vessels after treatment with CCl4 (original magnification, ×100 [middle panel]). Costaining with anti-CD3 (T cells) reveals that a significant number of Ccl5-positive cells are also positive for CD3 (original magnification, ×200 [bottom panel]).

