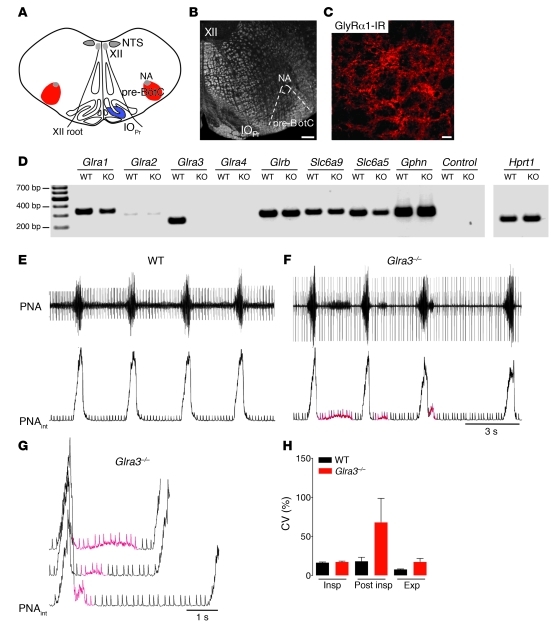
Figure 4. Characterization of the respiratory phenotype of Glra3–/– mice.
(A) Schematic of the pre-BötC with its anatomical landmarks. (B) Overview of C, which shows dense GlyRα1 immunoreactivity in the pre-BötC of Glra3–/– mice. Scale bars: 200 μm (B); 20 μm (C). (D) RT-PCR analysis of pre-BötC tissue of WT and Glra3–/– mice revealed expression of known components of glycinergic synapses. In WT mice, the receptor transcripts of GlyRα3 and GlyRα1 were the 2 most abundant in the pre-BötC. (E) Respiratory pattern of the WT mouse represented by the PNA in original and integrated (PNAint) forms. (F) In contrast to WT mice, Glra3–/– mice showed high variability in the post-inspiratory phase. (G) Post-inspiratory disturbances (red) of Glra3–/– at higher magnification, with superposition of 3 bursts derived from F. (H) CV (± SEM) of the duration of each phase of the respiratory cycle (inspiration, post-inspiration, and expiration) of WT versus Glra3–/– mice.

