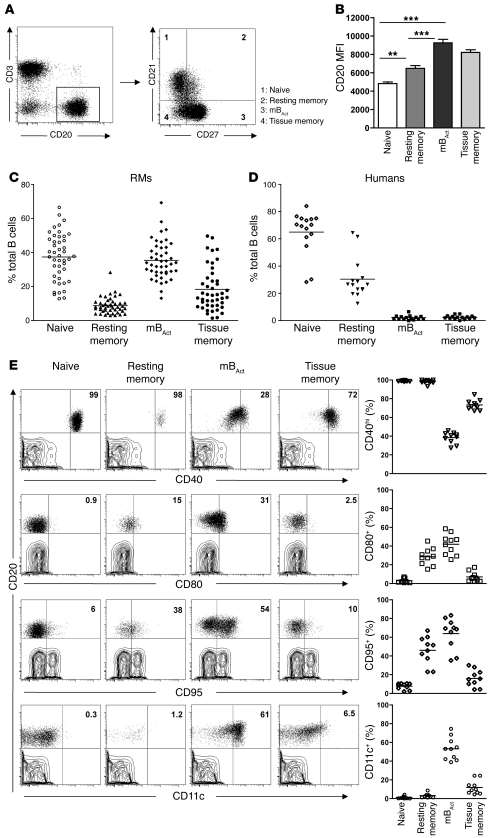
Figure 1. Identification of 4 phenotypically distinct B cell subsets in the peripheral blood of healthy RMs.
Flow cytometry was used to phenotypically characterize the B cell compartment in peripheral blood of healthy RMs. (A) Representative dot plots showing gating strategy used to identify B cell subsets: naive (CD21+CD27–), resting memory (CD21+CD27+), mBAct (CD21–CD27+), and tissue memory (CD21lo/–CD27–). (B) MFI of CD20 on B cell subsets. Bars represent mean ± SEM. (C) Frequencies of B cell subsets in peripheral blood of healthy RMs, with each data point representing an individual animal (n = 45). Horizontal lines represent means. (D) Distribution of B cell subsets in healthy human adults (n = 15), with each data point representing an individual donor. Horizontal lines represent medians. (E) Activation marker profiles of B cell subsets in healthy RMs (n = 10). Shown are representative dot plots (CD20-gated cell subsets overlaid on T cell contour plots) for each B cell subset and corresponding cumulative plots showing percentages of B cell subsets expressing CD40, CD80, CD95, and CD11c. Numbers within plots indicate the frequency of marker-positive cells as a percentage of the respective B cell subset. **P < 0.01; ***P < 0.001.

