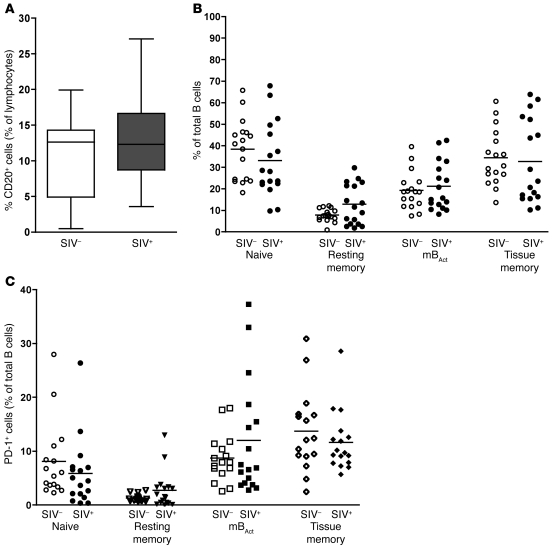
Figure 8. mBAct cells are not depleted in SIV-infected SMs.
(A) Percentage of total B cells in SIV– (n = 9) and SIV+ (n = 13) SMs. Boxes represent 25th–75th percentiles with medians, and whiskers represent 5th and 95th percentiles. (B) Percentage of B cell subsets (expressed as a percentage of total B cells) in SIV– (n = 9) and SIV+ (n = 13) SMs. (C) PD-1 expression on B cell subsets of SIV– (n = 9) and SIV+ (n = 13) SMs. The proportions of PD-1+ cells are expressed as a percentage of total CD20+ cells. Each data point represents an individual animal, and horizontal lines represent medians.

