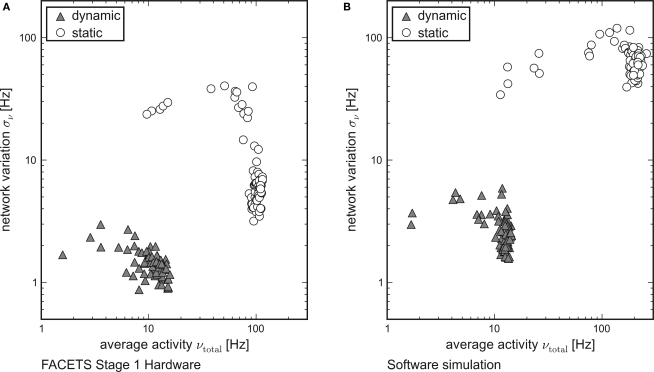
Figure 6.
Reliable and realistic network activity. Each point is determined by 20 random networks generated from equal probability distributions. The average firing rate of all networks is plotted on the x-axis, the standard deviation between the networks on the y-axis. Recurrent networks featuring short-term plasticity (triangles) can reliably be found within a close range. Setups with static synapses (circles) exhibit both larger average firing rates and larger standard deviations. (A) Emulation on the FACETS Stage 1 Hardware. (B) Software simulation with lowered excitatory reversal potential Ee.

