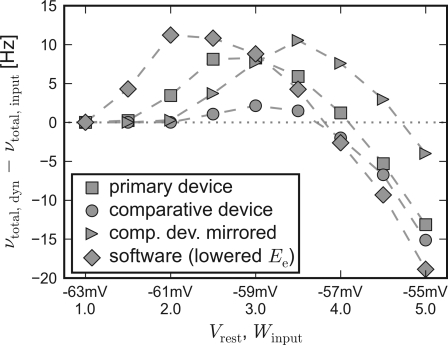
Figure 7.
Self-adjusting effect on different platforms. The difference Δν := νtotal,dyn − νtotal,input is plotted against an increasing strength and variability of the external network stimulation. The diamond symbols represent the data acquired with PCSIM. The square (circle) symbols represent data measured with the primary (comparative) hardware device. Measurements with the comparative device, but with a mirrored placing of the two network populations, are plotted with triangle symbols. See main text for details.

