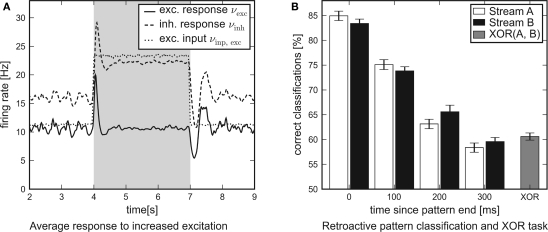
Figure 8.
Network traces of transient input. Results of software simulations testing the response of recurrent networks with dynamic synapses to transient input. (A) Firing rate of the excitatory input channels and average response of either population to an excitatory input pulse lasting for 3 s. The steep differential change in excitation is answered by a distinct peak. After some hundred milliseconds the networks attune to a new level of equilibrium. (B) Average performance of the architecture in a retroactive pattern classification task. The network states contain information on input spike patterns which were presented some hundred milliseconds ago. The latest patterns presented are to be processed in a non-linear XOR task.

