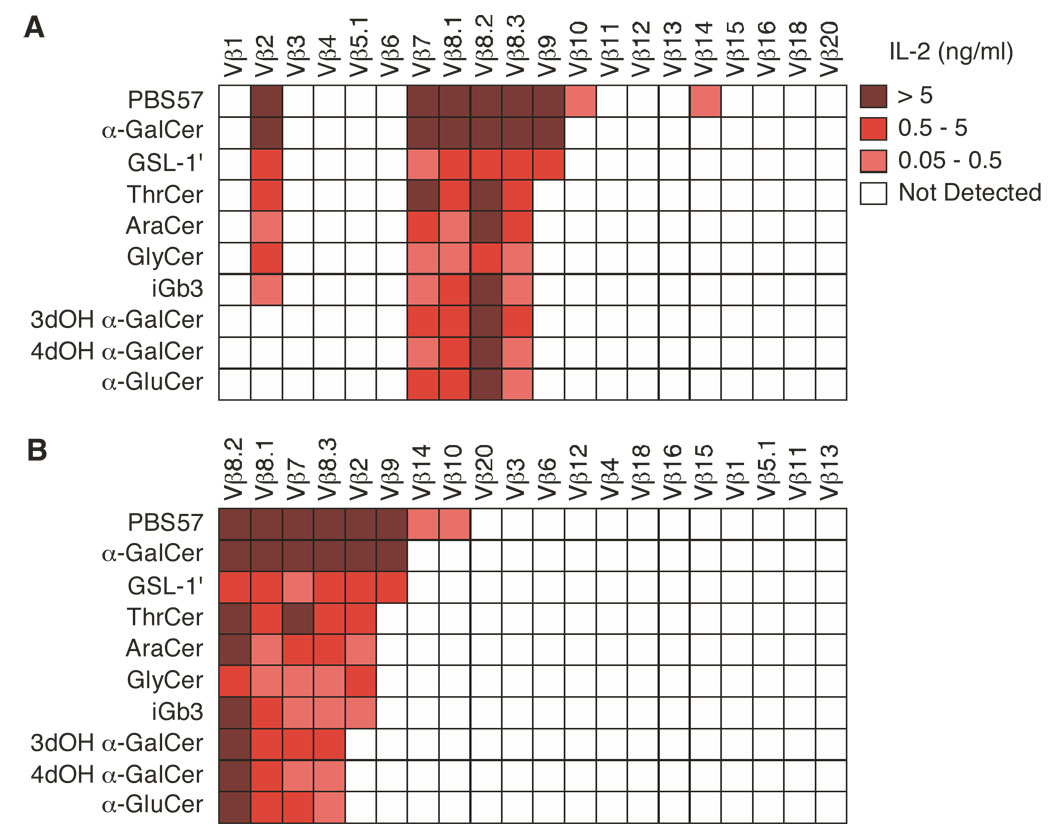
Figure 2.
Clustering of Vβ-containing iNKT TCRs according to antigen stimulation. (A, B) Enzyme-linked immunosorbent assay of IL-2 production by hybridomas expressing iNKT TCRs containing Vβ1 to Vβ20 TCRβ chains, stimulated with mCD1d-expressing A20 cells in the presence of PBS57 (1 µg/ml), αGC (1 µg/ml), GSL-1’ (1 µg/ml), ThrCer (0.2 µg/ml), AraCer (0.2 µg/ml), GlyCer (0.2 µg/ml), iGb3 (10 µg/ml), 3dOH αGC (1 µg/ml), 4dOH αGC (1 µg/ml) and α-GluCer (1 µg/ml). (B) Rearrangement of the strength of the response versus the number of hybridomas stimulated. Data represent the mean of two to four independent experiments.

