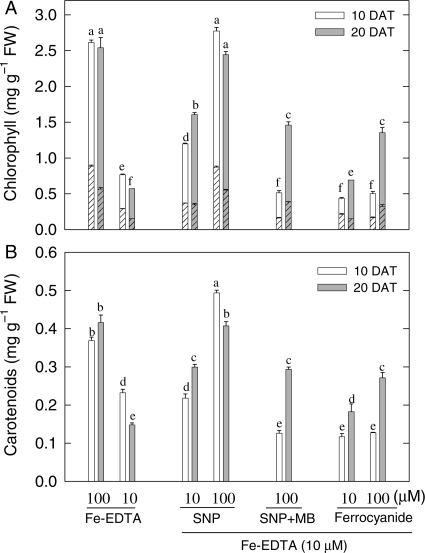
Fig. 2.
Effect of manipulating NO and Fe levels on chlorophyll a, b and carotenoids in young expanded leaves of maize. (A) Chlorophyll a (unhatched), chlorophyll b (hatched); (B) carotenoid concentrations. The plants were grown in sand culture with sufficient (100 µM Fe-EDTA) and deficient (10 µM Fe-EDTA) Fe supply. Some Fe-deficient plants were treated with 10 or 100 µM SNP, 100 µM SNP plus 100 µM MB or with 10 or 100 µM SF. Analyses were made 10 days (open bars) and 20 days (grey bars) after treatment (DAT). Bars carrying different letters are significantly different at P ≤ 0.05 after Bonferroni t-tests.

