Figure 4.
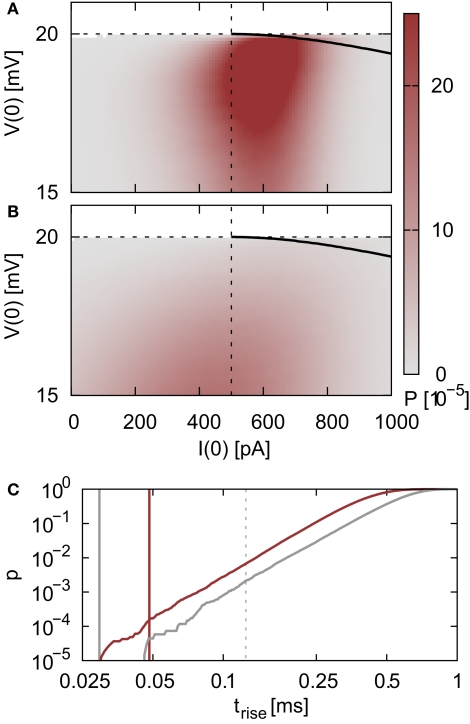
State density and rise times of the membrane potential excursion. (A) Density of states P(I(0),V(0)) for a neuron receiving a total input spike rate of 20.7 kHz with mean μ = 22 mV and standard deviation σ = 1.73 mV of the free membrane potential. The black edged area indicates the region in the state space where a threshold crossing will occur without additional input, V(trise) ≥ Θ. The horizontal dashed line indicates the firing threshold and the vertical dashed line indicates the minimum current that can cause a threshold crossing. (B) As in (A) but for a total input spike rate of 33.8 kHz with μ = 14.4 mV and σ = 3.39 mV. (C) Cumulative probability of trise for the states within the triangular areas (A; red, B; gray). Gray dashed vertical line indicates 0.125 ms. Red (0.048 ms) and gray (0.03 ms) vertical lines indicate the mean interspike intervals of the input firing rates in (A) and (B) respectively.

